
Here’s How to Stare Down an Erupting Volcano from the Comfort of Your Home
This post has been updated with a timelapse and high-resolution imagery of Etna
Dramatic but harmless (for now), Etna’s eruption makes an excellent case study for environmental security – a lesser-known application for Open-Source Intelligence (OSINT).
Mount Etna, Europe’s tallest active volcano, erupted on Tuesday, February 16th. Towering 3,350 meters over Catania on Sicily’s eastern coast, Etna has been belching smoke and ash for the past 48 hours.
More recent images also show lava spewing out of the snow-capped volcano.
(Hover over/tap on the images to see them in color)
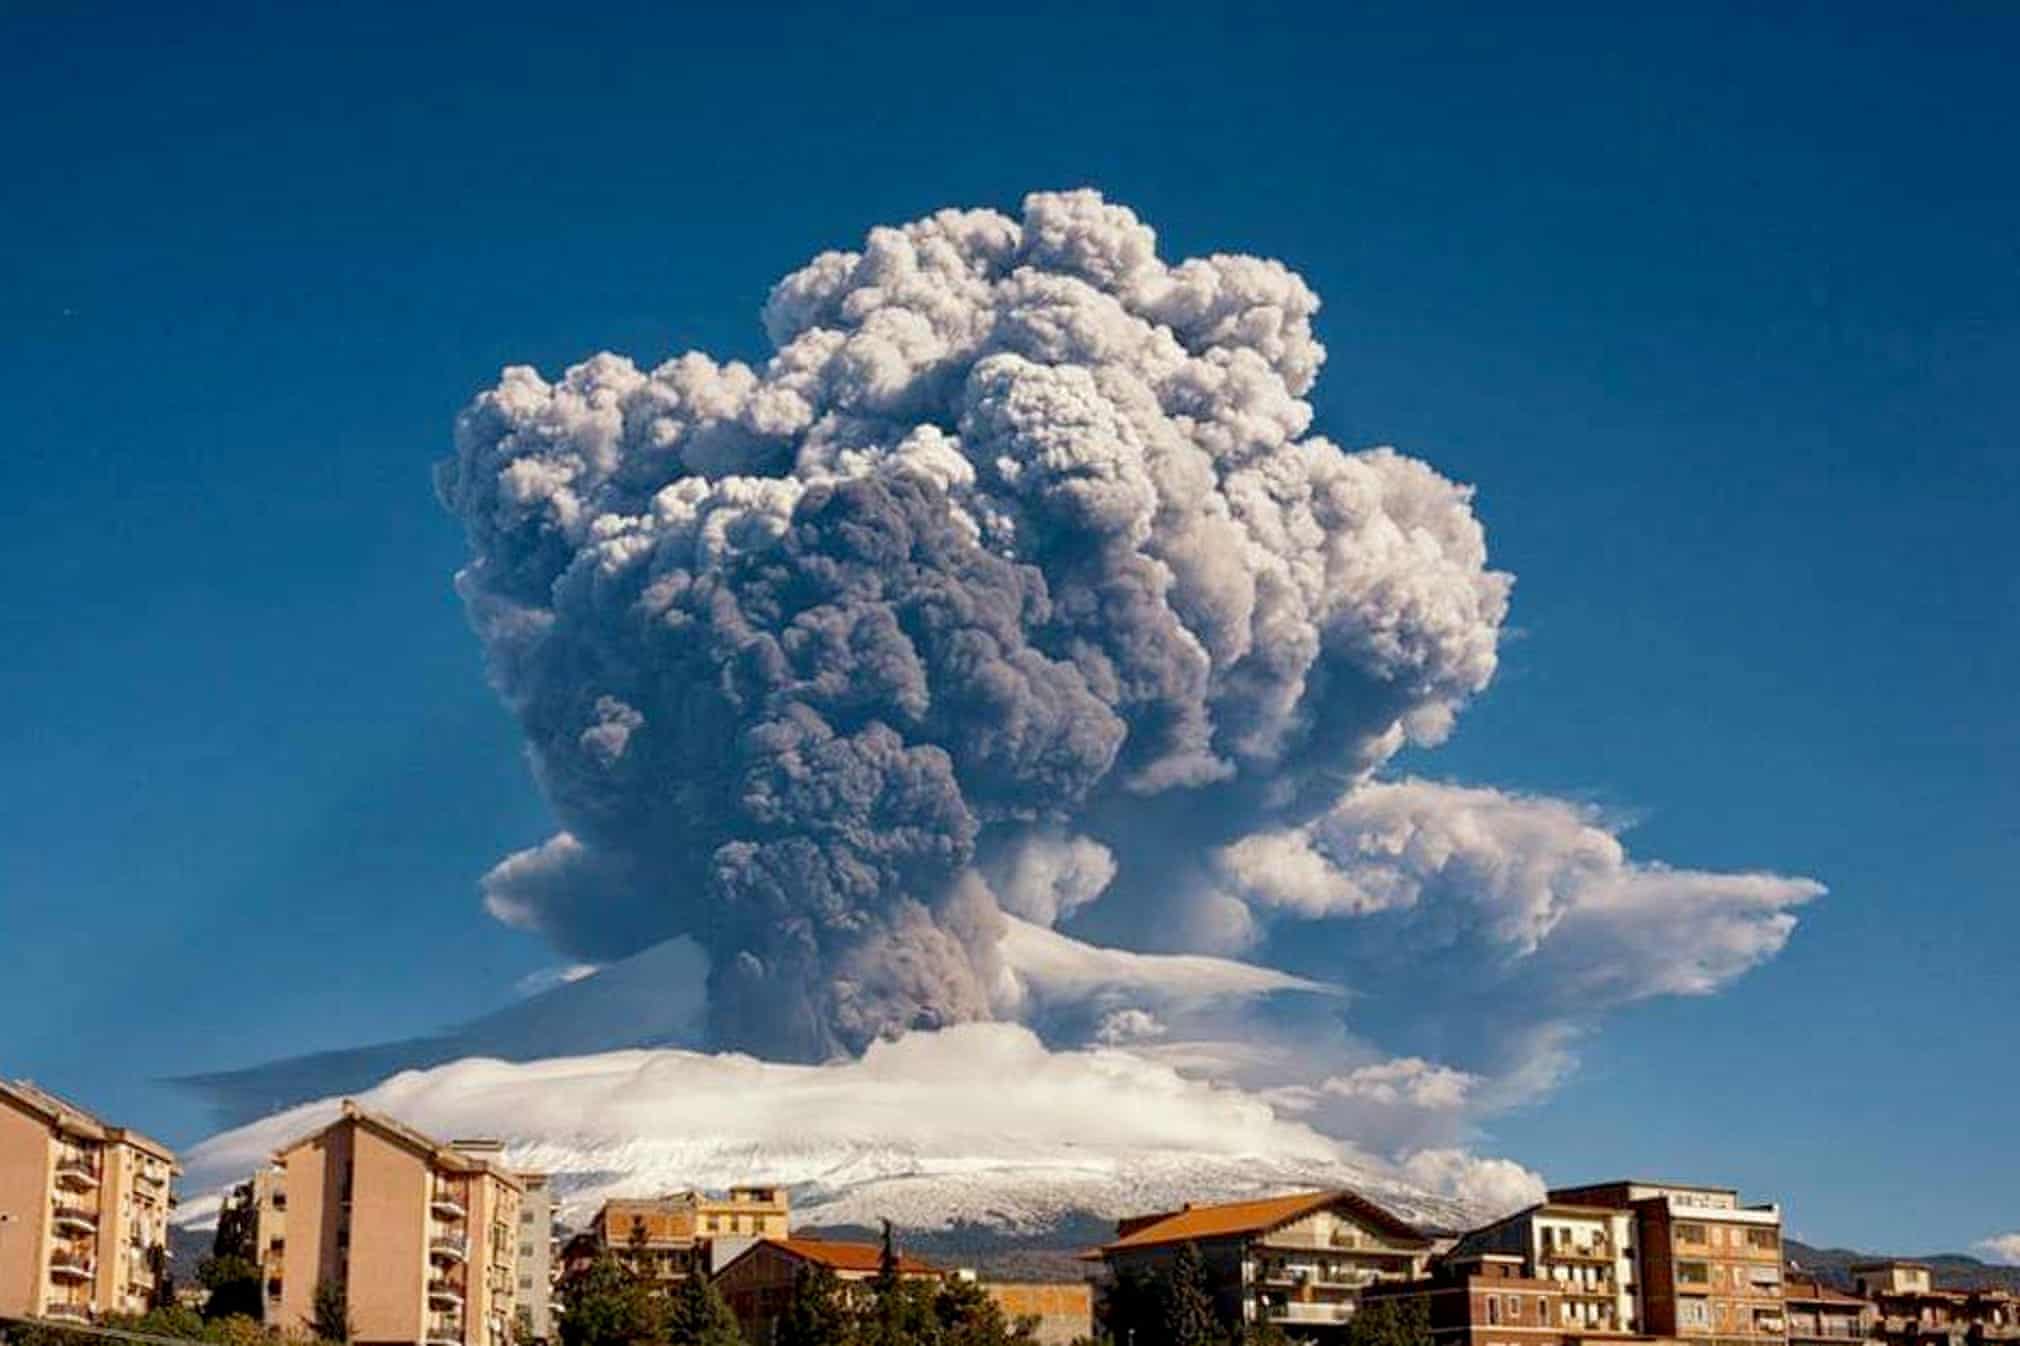
Smoke billows from Mount Etna on Tuesday Photograph: Davide Anastasi/AP
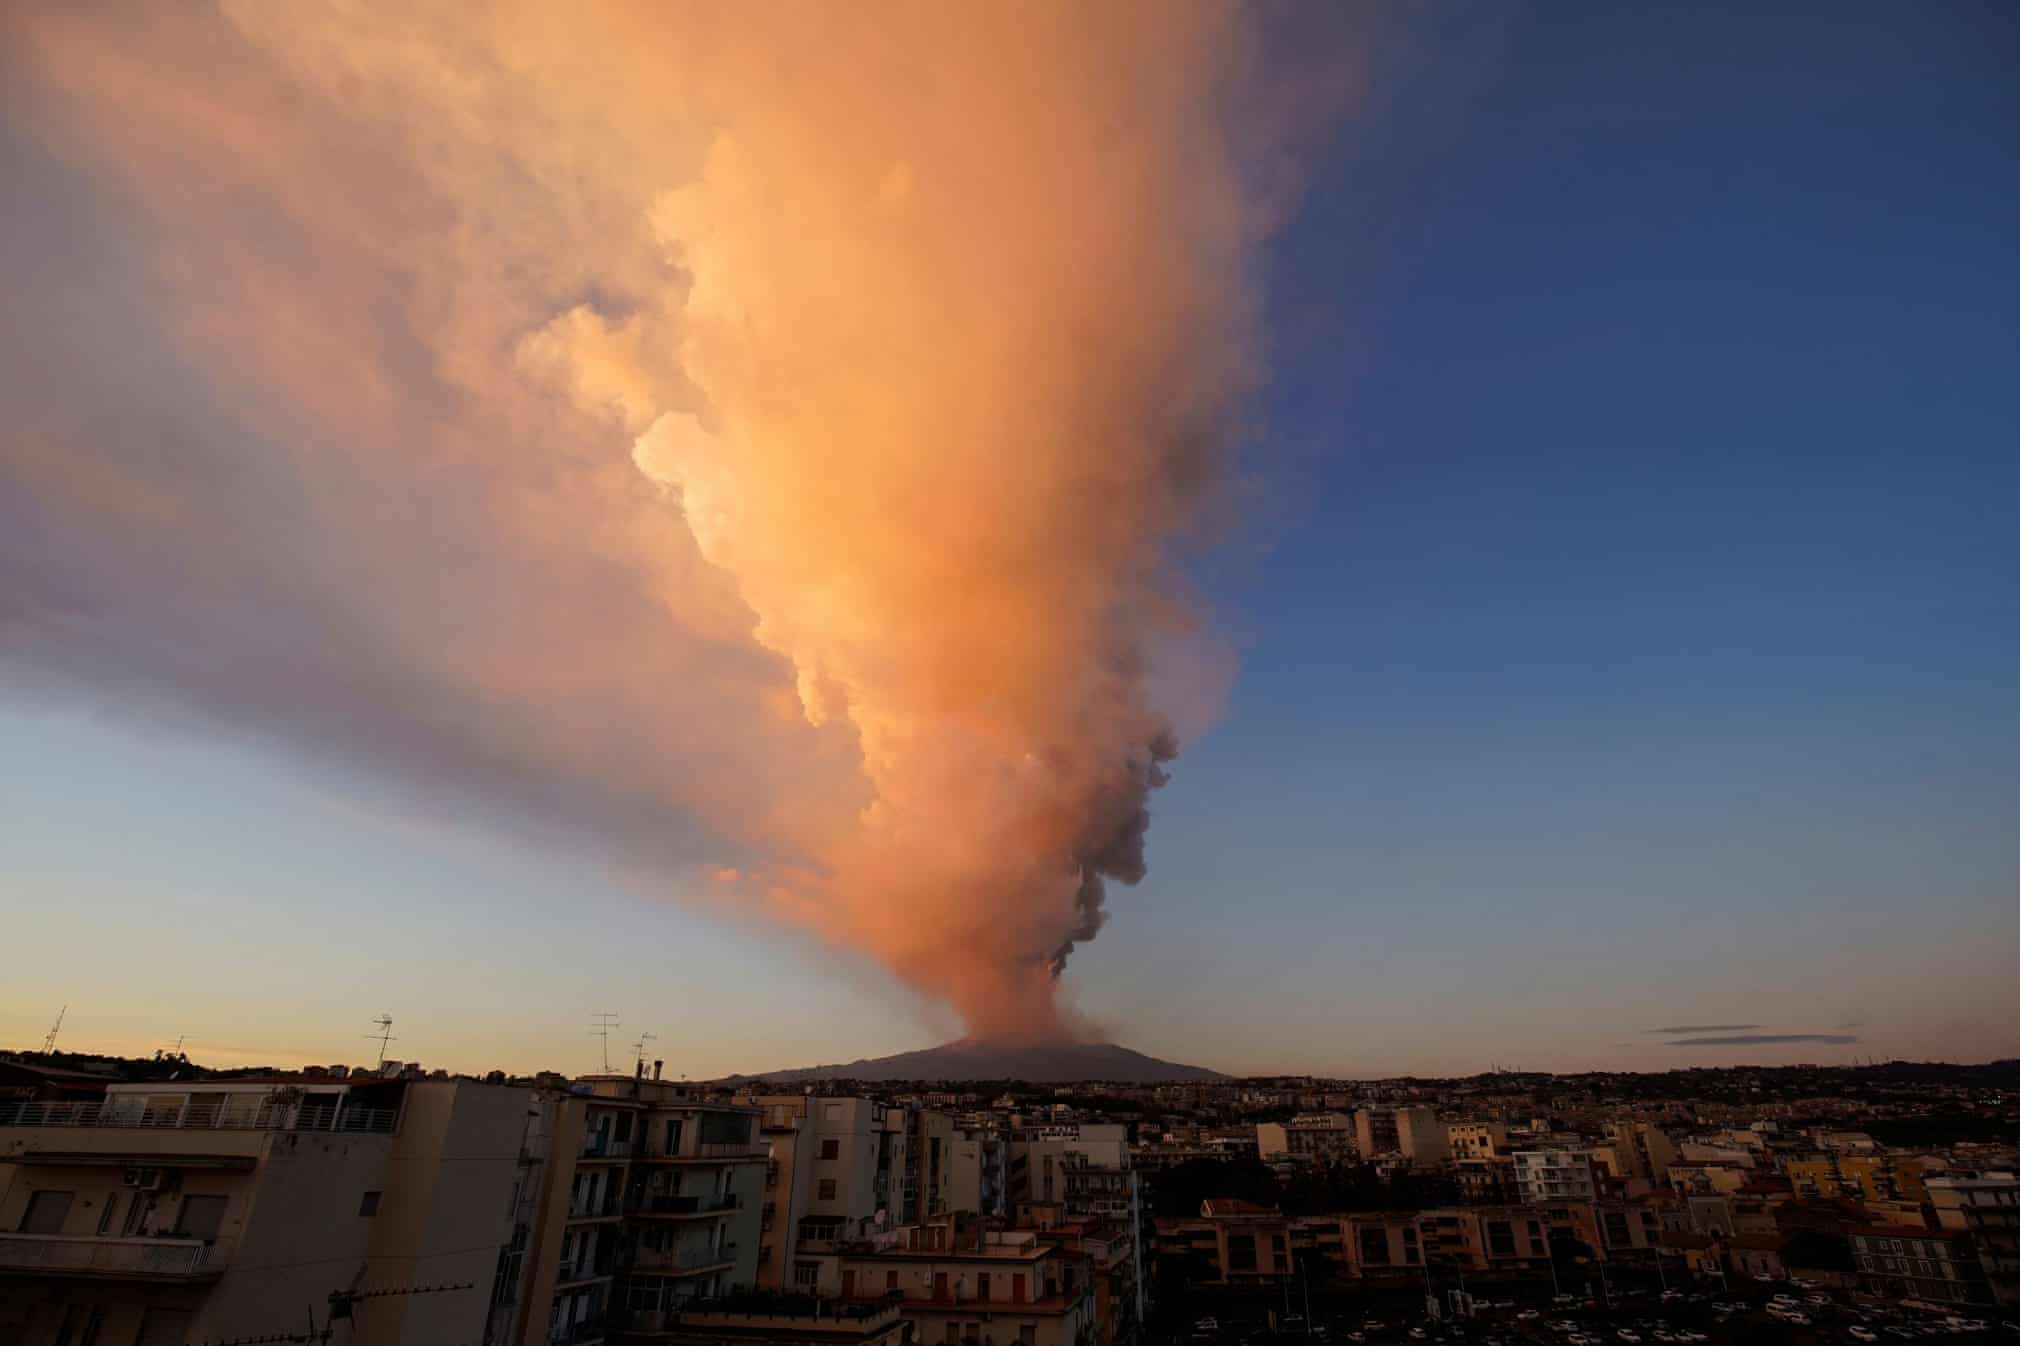
Tonnes of volcanic ash are thrown up into the atmosphere during the eruption Photograph: Antonio Parrinello/Reuters

Photograph: Antonio Parrinello/Reuters
“WE’SE SEEN WORSE”
Despite the dramatic scene, Italian authorities insist that the eruption is not significant.
“We’ve seen worse,” the head of the INGV National Institute for Geophysics and Volcanology of Catania, Stefano Branco, told Italian news agency AGI.
As a precaution, the nearby Catania airport temporarily suspended flights. A good call, considering that the wind is blowing from the northwest, pushing volcanic debris towards Catania (southeast of Etna) – see Zoom Earth weather simulation.

OSINT FOR THE ENVIRONMENT
Volcanic eruptions and wildfires are particularly easy to track and analyze using open-source GEOINT.
At the time of this article’s writing, the most recent Sentinel-2 imagery available on Sentinel Hub’s EO Browser dates from February 16th, when the eruption began. True-color imagery shows early signs of volcanic activity in three of Etna’s craters.

GEOINT analysis of Etna eruption in 16 Feb. 2021. False color view highlights calderas.
Smoke trails are also visible. They measure approximately 9 kilometers and are heading southward towards Catania and neighboring villages. That’s quite some information from a few clicks. But we can learn even more if we dive into the intricacies of false-color imagery.
BAND COMBINATIONS
Band combinations can be fun (and useful). And I’m not talking about mixing Nirvana with Linkin Park.
Satellite images are usually composed of multiple color bands. The natural-looking imagery is a mixture of Red, Green, and Blue, or RGB. But you can affect many other combinations to highlight certain features on Earth – burn marks, moisture, fire, water quality, soil fertility, etc.
Because of these combinations, satellite images can gain an unnatural look (false color), with the ground appearing blue and the snow red; or the water green and the clouds cyan.
BEYOND TRUE COLOR
In this case, I found the ready-made “False Color (urban)” from Sentinel’s Vulcanoes theme to work best.
Calderas are displayed in red and yellow, while the snow blanketing mount Etna receives a blue makeover – can’t hope for a better contrast than that!
The Short wave infrared (SWIR) composite is a good alternative but better suited for mapping fire damage. Check out the example below for reference (tap or click on the image to see it in color).

Etna eruption (16-2-2021) seen in standard natural color and two false color views
Both bandings help us localize the volcanic activity and note that Etna is blowing steam from all of its major craters. This is something we couldn’t have noticed on natural color imagery because of vapors, smoke, cloud cover, and the bright white snow – and the mixture of all of them.
Long story short, a simple operation like this allows you to stare into Sauron’s lair from the comfort of your living room – How OSINTy!
Stick around! I’ll make sure to post a timelapse of Etna’s “hot and heavy” activity as soon as new imagery becomes available.
Update – 19 Feb 2021
Promises made, promises kept – here’s a timelapse comparing the eruption day (16 Feb) and yesterday (18 Feb).
1. Natural Color
- The snow on mount Etna’s eastern side has completely melted. True-color imagery hints at why this happened (notice the dark, scorched aspect). However, it only becomes crystal clear on false-color imagery.
- Color and density change in smoke plumes, likely caused by a shift in volcanic activity. Also, notice the smoke blowing eastward, signifying a change in wind patterns.

2. False Color

- False Color imagery reveals how molten lava (red) spilled downhill Etna’s eastern slope (4 km long/ 1.36 km2) and all around the southeastern crater. The temperature of lava flow usually varies between 700° to 1,250° C, hence why all that snow disappeared (blue).
- Lava is hazardous for vegetation and forrest as it can spark wildfires. The affected areas will require targeted-scans using spectral views designed to monitor wildfires.
- We also observe a significant decrease in activity at the other two major craters. While this might sound good, it is too early to tell if the eruption is coming to an end.
Update 2 – 1 March 2021
Thanks to SOAR Earth’s generosity, we have obtained a breathtaking high-resolution imagery of Etna volcano (I recommend all geospatial geeks to check out SOAR’s all-in-one portal!). Taken at 50 cm/px resolution on February 24th, the image captured a moment of decreased activity in all of Etna’s craters.

Don’t forget to click/hover over the image to see it in full color
The latest update from the National Institute of Geophysics and Volcanology (28 Feb 2021), which you can read here, suggests that Etna is returning to a calmer state. More exactly, the institute notes that “lava supply is decreasing and cooling down”. Scientists have also observed the amplitude of volcanic tremor and infrasonic activity return to medium-low values.
Hopefully it will stay that way, and Etna (as well as Sicily) can finally get some rest.
by Vlad Sutea
OSINT Instructor
Cover photo © SOAR Earth
